by Michael Lorenz | Rohde & Schwarz
“In mobile communications, trust is good but measurements are better,” says Hubert Aiwanger, Bavarian minister for economic affairs, state development and energy. The German state of Bavaria ordered a fourth review of mobile network operator license obligations. The review focuses on how well operators met the minimum data rate of 100 Mbps on federal roads and selected railway lines.
In many countries mobile network operator licenses stipulate that license holders must meet simple coverage requirements or provide specified data throughput levels. Mobile network operators normally use online coverage maps based on predictions from a radio network planning tool. Since providing a complete picture for an entire country is almost impossible, this predictive approach is generally accepted.
Real world verification is needed for insight into how well or poorly areas are covered. This article does not look at measurement campaign results, but explains the test methodology for finding answers. When validating minimum data throughputs, smartphone usage and gigabyte or terabyte downloads are the first things that come to mind, followed by the costs associated with unlimited tariffs for all the mobile network operators in a country and other factors. Data throughput testing is always a snapshot that looks at shared resources, while the current network load remains unknown. Traffic steering mechanisms might push a test phone to another carrier (frequency) with lower bandwidth.
Alternatives to smartphones when estimating network performance
Network scanners such as our R&S®TSME6 can simultaneously and passively measure multiple technologies and bands. MIB and SIB decoding sorts the measured cells by mobile network operator (MNO) without any SIM cards. A network scanner generates a complete picture of radio network coverage for all cells, technologies and bands. Smartphones can only measure and report on active cells or provide limited information about neighboring cells assigned by the network. Of course, a network scanner cannot measure data throughput, but signal levels can be converted into possible data rates.
Converting signal levels to LTE data rates
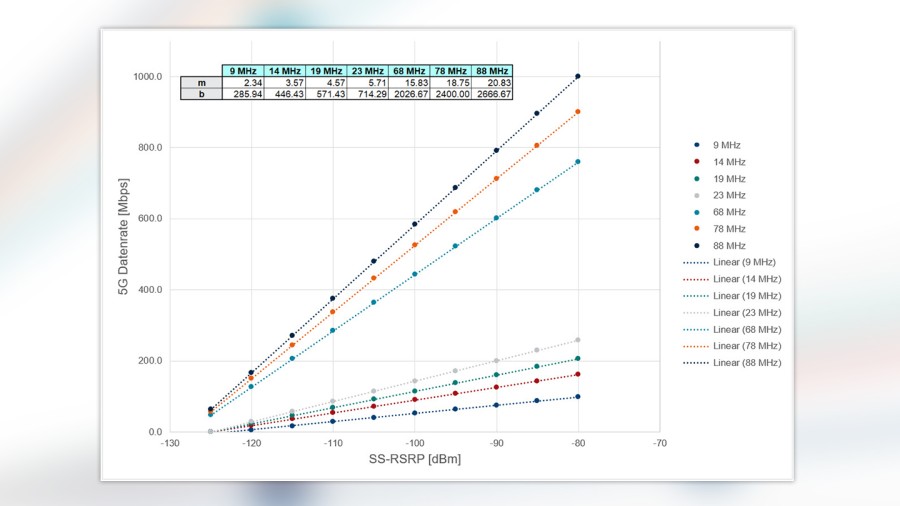
In the ten years since the roll out of LTE networks, several attempts have been made to find a correlation between Reference Signal Received Power (RSRP) levels and data rates. The analysis plots data throughput against signal levels. The scatter plot reveals correlations and the relevant trendline for the maximum possible data throughput. Bandwidth needs to be taken into consideration since doubling bandwidth doubles data throughput. Simple linear functions defined by bandwidth can be used to calculate possible data throughput for the measured signal levels.
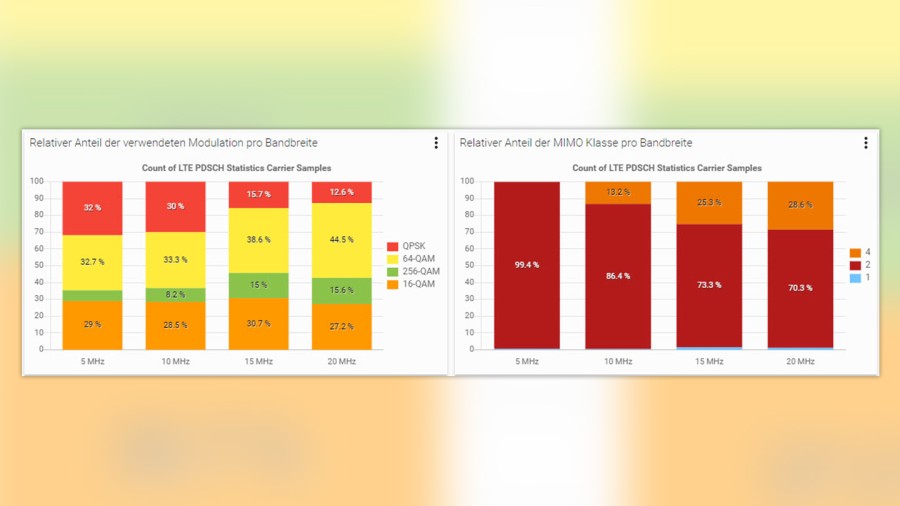
Higher order modulation schemes (256 QAM) and high order MIMO (4×4) also affect the maximum data rates and must be taken into consideration. We analyzed the modulation and MIMO layers for the most realistic absolute maximum data throughput by bandwidth. Note that capacity testing (parallel HTTP download with up to 10 streams) for data throughput, modulation and MIMO analysis can only be done in the downlink stream.
A similar empirical model for 5G
5G networks are growing daily. The first 5G networks were deployed in non-standalone (NSA) mode with LTE as an anchor. In these E-UTRAN New Radio – Dual Connectivity (ENDC) scenarios, the scheduler decides how much data to transfer via 5G and/or LTE. The available resource blocks in both technologies are not fully allocated and one is preferred. Again, this is purely the decision of the scheduler and depends on circumstances.
The networks under test were fully 5G-NSA for all three mobile network operators. Plotting the data throughput versus the SS-RSRP signal level based on the 5G bandwidth reveals a seemingly chaotic cloud of dots indicating that any data rate is possible for a given signal level.
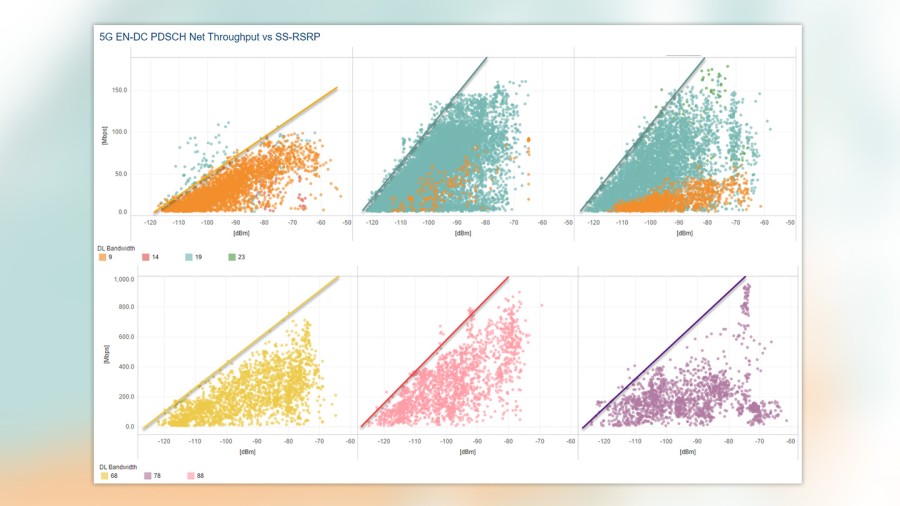
The scatter plots reveal in essence that the data rate cannot be exceeded for a given signal level, as indicated by the lines. The trendline indicates the maximum achievable data throughput for a signal level and bandwidth.
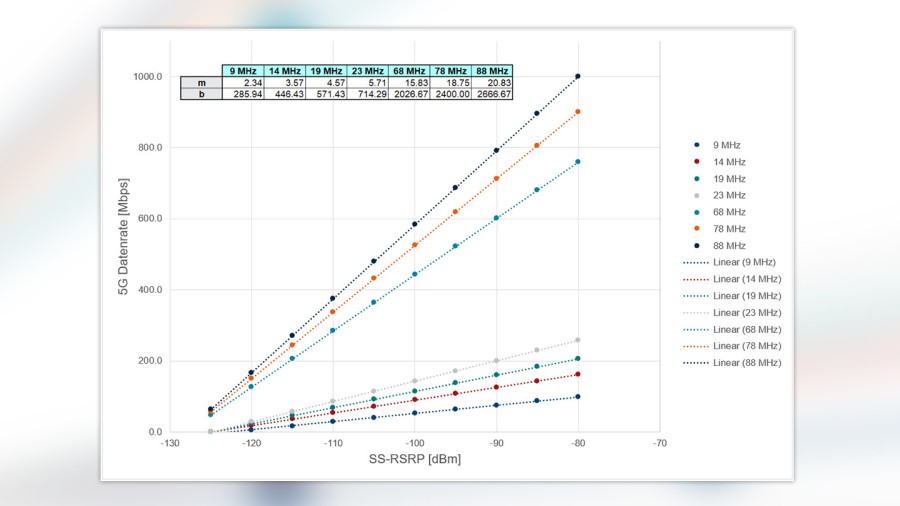
The results are summarized with the description of simple linear functions per bandwidth, where m describes the slope and b the axis.
Converting model figures into LTE-advance, ENDC or 5G SA data rates
The models are easy to understand since they apply to a single carrier scenario with a fixed bandwidth. A smartphone is the simplest way to measure real data throughput. The result serves as a snapshot while taking into account shared recourses, traffic steering, missing supported band combinations or other user equipment capability restrictions that can limit or reduce the possibilities for a given time or location in the mobile network under test.
The strength of the network scanner can be seen clearly here. Measuring for all technologies, bands and carriers (frequencies) for a mobile network operator at each measurement point enables a calculation of the possible data rate at each point (or geographic bin) for a single carrier, which can then be combined for carrier aggregation. Going back and using high end smartphones, we know how many component carriers can be aggregated for each mobile network operator. Our project used a carrier aggregation of up to 4 Component Carriers (4CCA). At most measurement points (or bins) more than four carriers were observed for each mobile network operator. After proper mathematical aggregation and choosing carriers for consideration, the defined cell priorities for each LTE carrier E-UTRA Absolute Radio Frequency Channel Number (EARFCN) is read out from the SIB messages that the network scanner has decoded and considered. A similar approach is used for 5G.
A possible data rate can be calculated for up to 4CCAs for LTE-only devices using this information. A 5G carrier that mimics 5G capable devices in NSA mode can be added to show the rates for a 5G smartphone in standalone (SA) mode.


