– Q2 FY 2024: Revenue €3.632 billion, Segment Result €707 million, Segment Result Margin 19.5 percent
– Outlook for FY 2024: Based on an assumed exchange rate of US$1.10 to the euro, Infineon now expects to generate revenue of around €15.1 billion plus or minus €400 million (previously €16 billion plus or minus €500 million), with a Segment Result Margin of around 20 percent (previously in the low to mid-twenties percentage range) at the mid-point of the guided revenue range. Adjusted gross margin will be in the low-forties percentage range (previously in the low to mid-forties percentage range). Investments are planned at around €2.8 (previously around 2.9 billion). Adjusted Free Cash Flow of about €1.6 billion (previously €1.8 billion) and reported Free Cash Flow of about €0 million (previously about €200 million) are now expected
– Outlook for Q3 FY 2024: Based on an assumed exchange rate of US$1.10 to the euro, revenue of around €3.8 billion expected. On this basis, the Segment Result Margin is forecast to be in the high-teens percentage range
Infineon Technologies AG is reporting results for the second quarter of the 2024 fiscal year (period ended 31 March 2024).
„In the prevailing difficult market environment, Infineon delivered a solid second quarter”, says Jochen Hanebeck, CEO of Infineon. “Many end markets have remained weak due to economic conditions, while customers and distributors have continued to reduce semiconductor inventory levels. Weak demand for consumer applications persists. There has also been a noticeable deceleration in growth in the automotive sector. We are therefore taking a cautious approach to the outlook for the rest of the fiscal year and are lowering our forecast. In the medium to long term, decarbonization and digitalization will continue to be strong structural drivers of our profitable growth. In order to realize the full potential of our Company, we will further strengthen our competitiveness. To this end, we are launching the company-wide “Step Up” program. We are aiming to achieve structural improvements in our Segment Result in the high triple-digit million euro range per year.”
Group performance in the second quarter of the 2024 fiscal year
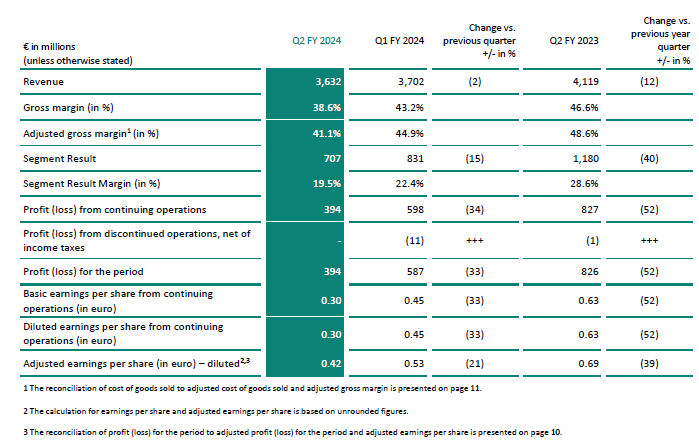
In the second quarter of the 2024 fiscal year, Infineon generated Group revenue of €3,632 million. This was 2 percent down on revenue in the prior quarter of €3,702 million. In the Automotive (ATV) segment, revenue remained stable compared with the prior quarter, while in the Green Industrial Power (GIP) and Power & Sensor Systems (PSS) segments revenue was lower. The Connected Secure Systems (CSS) segment saw a slight increase in revenue from the first quarter of the 2024 fiscal year.
The gross margin achieved in the second quarter of the current fiscal year was 38.6 percent, compared with 43.2 percent in the prior quarter. The adjusted gross margin was 41.1 percent, compared with 44.9 percent in the first quarter of the fiscal year.
The Segment Result in the second quarter of the 2024 fiscal year was €707 million, compared with €831 million in the prior quarter. The Segment Result Margin achieved was 19.5 percent, compared with 22.4 percent in the first quarter.
The Non-Segment Result for the second quarter of the 2024 fiscal year was a net loss of €211 million, compared with a net loss of €129 million in the prior quarter. The second-quarter Non-Segment Result comprised €91 million relating to cost of goods sold, €18 million relating to research and development expenses and €54 million relating to selling, general and administrative expenses. In addition, it included net operating expenses of €48 million. This figure includes impairment losses of €37 million relating to the write-down of assets in connection with the planned sale of two backend manufacturing sites in Cheonan (South Korea) and Cavite (Philippines).
Operating profit for the second quarter of the 2024 fiscal year reached €496 million, compared with €702 million in the prior quarter.
The financial result in the second quarter of the current fiscal year was a net loss of €12 million, compared with a net gain of €25 million in the prior quarter. The financial result for the first quarter included interest income of €32 million arising on the release of a tax risk provision in conjunction with the acquisition of Cypress.
The tax expense in the second quarter of the 2024 fiscal year amounted to €93 million, compared with €134 million in the prior quarter.
Profit from continuing operations in the second quarter of the current fiscal year was €394 million, compared with €598 million in the first quarter. The result from discontinued operations was €0 million, after a loss of €11 million in the preceding quarter. The profit for the period achieved in the second quarter of the current fiscal year was €394 million. In the first quarter of the 2024 fiscal year, the profit for the period was €587 million.
Earnings per share from continuing operations decreased in the second quarter of the 2024 fiscal year to €0.30, from €0.45 in the prior quarter (basic and diluted in each case). Adjusted earnings per share1 (diluted) stood at €0.42 at the end of the second quarter of the current fiscal year, compared with €0.53 one quarter earlier.
Investments – which Infineon defines as the sum of investments in property, plant and equipment, investments in other intangible assets and capitalized development costs –totaled €643 million in the second quarter of the current fiscal year, compared with €653 million in the first quarter. Depreciation and amortization in the second quarter of the 2024 fiscal year amounted to €467 million, compared with €456 million in the preceding quarter.
Free Cash Flow2 improved in the second quarter of the current fiscal year to €82 million, compared with a negative figure of €1,597 million in the prior quarter. The figure for the first quarter of the 2024 fiscal year included purchase price payments of around €800 million relating to the acquisition of companies, mainly the acquisition of GaN Systems Inc. Annual bonus payments were also made in the first quarter of the 2024 fiscal year for the record 2023 fiscal year.
The gross cash position decreased from €2,712 million at the end of the first quarter of the 2024 fiscal year to €2,583 million at the end of the second quarter. In the course of the second quarter, the dividend of €456 million was paid and €233 million was utilized to buy back own shares related with the employee stock option plan. Set against this was the issue of a €500 million bond. Financial debt at 31 March 2024 stood at €5,941 million, compared with €5,398 million at 31 December 2023. The net cash position was therefore a negative amount of €3,358 million, compared with a negative amount of €2,686 million at the end of the first quarter.
Segment earnings for the second quarter of the 2024 fiscal year
ATV segment revenue remained stable in the second quarter of the 2024 fiscal year, totaling €2,078 million, compared with €2,085 million in the first quarter. Set against increasing revenues in electromobility was a slightly lower level of revenue from ADAS. Revenue from classical car components was unchanged. The Segment Result in the second quarter of the current fiscal year was €512 million, compared with €564 million in the first quarter of the 2024 fiscal year. The Segment Result Margin achieved was 24.6 percent, compared with 27.1 percent in the prior quarter.
In the second quarter of the 2024 fiscal year, GIP segment revenue decreased by 4 percent to €469 million, compared with €487 million in the first quarter. As a result of high direct customer and distributor inventory, demand in the areas of renewable energy and energy infrastructure was weaker. The Segment Result in the second quarter of the current fiscal year amounted to €89 million, compared with €130 million in the first quarter of the 2024 fiscal year. The Segment Result Margin was 19.0 percent, compared with 26.7 percent in the prior quarter.
PSS segment revenue decreased in the second quarter of the 2024 fiscal year by 7 percent to €713 million, compared with €765 million in the prior quarter. The reason for the decline in revenue was ongoing weak demand for components for PCs, notebooks, consumer electronics, battery-powered devices and microinverters for roof-top solar systems. Revenue from silicon microphones and components for smartphones continued to recover. The Segment Result achieved in the second quarter of the current fiscal year was €64 million, compared with €99 million in the first quarter. The Segment Result Margin was 9.0 percent, compared with 12.9 percent in the prior quarter.
CSS segment revenue increased slightly in the second quarter of the 2024 fiscal year to €371 million, up from €364 million in the first quarter. The growth in revenue of 2 percent was mainly the result of a higher level of sales relating to Wi-Fi. The Segment Result rose to €42 million, from €37 million in the prior quarter. The Segment Result Margin increased to 11.3 percent, from 10.2 percent in the first quarter.
Outlook for the 2024 fiscal year
Based on an assumed exchange rate of US$1.10 to the euro, revenue in the 2024 fiscal year is now expected to be around €15.1 billion plus or minus €400 million (previously €16 billion plus or minus €500 million). The adjustment of the forecast for the fiscal year is due to prolonged weak demand in major target markets as well as ongoing destocking at direct customers and distributors.
In the Automotive segment, revenue growth in the low to mid-single-digit percentage range is now expected. The decrease in revenue in the Green Industrial Power segment in comparison with the prior fiscal year is expected to be a low-teens percentage figure. The decline in revenue in Power & Sensor Systems is forecast to be in the high-teens and in the Connected Secure Systems segment in the low-twenties percentage range. With expected revenue in the 2024 fiscal year of €15.1 billion, the adjusted gross margin should be in the low-forties percentage range and the Segment Result Margin is expected to be around 20 percent. The Segment Result Margin for the Automotive segment is expected to be at the lower end of the aforementioned range of between 25 and 28 percent.
Investments – which Infineon defines as the sum of investments in property, plant and equipment, investments in other intangible assets and capitalized development costs – are now being slightly adjusted to a figure of about €2.8 billion (previously about 2.9 billion) for the 2024 fiscal year. The focus here will be investments in the manufacturing module at the Kulim site (Malaysia), which is designed to produce compound semiconductors, as well as the manufacturing module in Dresden (Germany), designed to produce analog/mixed-signal components.
Depreciation and amortization are anticipated to be around €1.9 billion in the 2024 fiscal year, of which around €400 million is attributable to amortization of purchase price allocations arising mainly from the acquisition of Cypress. Adjusted Free Cash Flow, which is adjusted for investment in large frontend buildings and the purchase of GaN Systems, is now expected to be about €1.6 billion (previously €1.8 billion), which is about 11 percent of the forecast revenue for the year of €15.1 billion. Reported Free Cash Flow should be around €0 million (previously €200 million). Return on Capital Employed (RoCE) is now forecast to reach around 9 percent. When the figures for Q1 FY 2024 were published, RoCE for the 2024 fiscal year was expected to be around 11 percent.
Outlook for the third quarter of the 2024 fiscal year
Based on an assumed exchange rate of US$1.10 to the euro, Infineon expects to generate revenue of around €3.8 billion in the third quarter of the 2024 fiscal year. Revenue in the ATV and CSS segments should grow in-line with group average quarter-on-quarter. Quarter-on-quarter growth rate for the GIP segment is expected to be belowand for PSS beyond group average. Based on this revenue forecast for the Group, the Segment Result Margin should be in the high-teens percentage range.
Structural improvement program “Step Up” to strengthen competitiveness
The Company wants to further strengthen its competitiveness. To this end, Infineon is starting the “Step Up” program focusing on a targeted, sustainable improvement of its cost structure. The program includes various packages of measures focusing on the areas of manufacturing productivity, portfolio management, pricing quality and operating cost optimization without compromising the Company’s innovative strength.
The program is expected to have a positive effect on the Segment Result in the high triple-digit million euro range per year (based on the 2023 fiscal year). The first financial benefits are expected in the course of the 2025 fiscal year. The full effect is expected to show in the first half of the 2027 fiscal year.
Telephone press conference and analyst telephone conference
The Management Board of Infineon will host a telephone press conference with the media at 8:00 am (CEST), 2:00 am (EDT). It can be followed over the Internet in both English and German. In addition a telephone conference call including a webcast for analysts and investors (in English only) will take place at 9:30 am (CEST), 3:30 am (EDT). During both calls, the Infineon Management Board will present the Company’s results for the second quarter of the 2024 fiscal year as well as the outlook for the third quarter and the 2024 fiscal year. The conferences will also be available live and for download on Infineon’s website at www.infineon.com/investor
The Q2 Investor Presentation is available (in English only) at:
https://www.infineon.com/cms/en/about-infineon/investor/reports-and-presentations/
FINANCIAL INFORMATION
According to IFRS – Unaudited
The following financial data relates to the second quarter of the 2024 fiscal year ended 31 March 2024 and the corresponding prior quarter and prior year period.
Revenues, Results and Margins of the Segments
Segment Result is defined as operating profit excluding certain net impairments and reversal of impairments, the impact on earnings of restructuring and closures, share-based payment, acquisition-related depreciation/amortization and other expense, impact on earnings of sales of businesses or interests in subsidiaries, and other income (expense).
Reconciliation of Segment Result to operating profit
Reconciliation to adjusted earnings and adjusted earnings per share – diluted
Earnings per share in accordance with IFRS are influenced by amounts relating to purchase price allocations for acquisitions (in particular Cypress), as well as by other exceptional items. To enable better comparability of operating performance over time, Infineon computes adjusted earnings per share (diluted) as follows:
Adjusted profit (loss) for the period and adjusted earnings per share (diluted) should not be seen as a replacement or superior performance indicator, but rather as additional information to the profit (loss) for the period and earnings per share (diluted) determined in accordance with IFRS.
Reconciliation to adjusted cost of goods sold and gross margin
The cost of goods sold and the gross margin in accordance with IFRS are influenced by amounts relating to purchase price allocations for acquisitions (in particular Cypress) as well as by other exceptional items. To enable better comparability of operating performance over time, Infineon computes the adjusted gross margin as follows:
Adjusted cost of goods sold and the adjusted gross margin should not be seen as a replacement or superior performance indicator, but rather as additional information to cost of goods sold and the gross margin determined in accordance with IFRS.
Number of employees
Consolidated Statement of Financial Position
Consolidated Statement of Cash Flows
Gross and Net Cash Position
The following table shows the gross cash position and the net cash position. Since some liquid funds are held in the form of financial investments which for IFRS purposes are not classified as cash and cash equivalents, Infineon reports on its gross and net cash positions in order to provide investors with a better understanding of its overall liquidity situation. The gross and net cash positions are determined as follows from the Consolidated Statement of Financial Position:
Free Cash Flow
Infineon reports the Free Cash Flow figure, defined as cash flows from operating activities and cash flows from investing activities, both from continuing operations, after adjusting for cash flows from the purchase and sale of financial investments. Free Cash Flow serves as an additional performance indicator, since Infineon holds part of its liquidity in the form of financial investments. This does not mean that the Free Cash Flow calculated in this way is available to cover other disbursements, as dividends, debt-servicing obligations and other fixed disbursements have not been deducted. Free Cash Flow should not be seen as a replacement or as a superior performance indicator, but rather as a useful item of information in addition to the disclosure of the cash flow reported in the Consolidated Statement of Cash Flows, and as a supplementary disclosure to other liquidity performance indicators and other performance indicators determined in accordance with IFRS. Free Cash Flow is derived as follows from the Consolidated Statement of Cash Flows:
Condensed Consolidated Statement of Cash Flows
D I S C L A I M E R
This press release contains forward-looking statements about the business, financial condition and earnings performance of the Infineon Group.
These statements are based on assumptions and projections resting upon currently available information and present estimates. They are subject to a multitude of uncertainties and risks. Actual business development may therefore differ materially from what has been expected. Beyond disclosure requirements stipulated by law, Infineon does not undertake any obligation to update forward-looking statements.
Due to rounding, numbers presented throughout this press release and other reports may not add up precisely to the totals provided and percentages may not precisely reflect the absolute figures.
All figures mentioned in this press release are unaudited.


