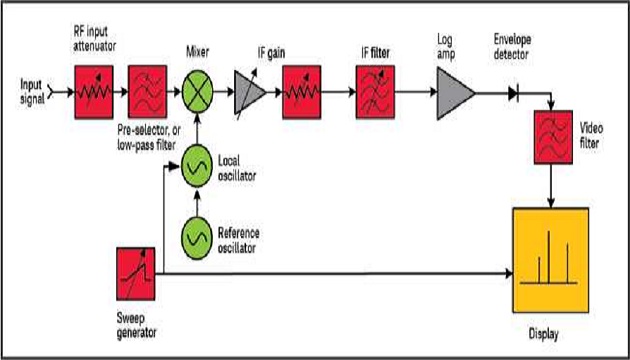
A spectrum analyzer or signal analyzer is an essential and fundamental measurement tool for an RF engineer, used in all phases of the product life cycle. At the most basic level, it can be described as a frequency-selective, peak-responding voltmeter calibrated to display the Root Mean Square (RMS) value of a sine wave. Its performance, accuracy and speed are important to enable R&D engineers enhance their designs and manufacturing to improve test efficiency and product quality.
Why spectrum measurement?
The frequency domain has its measurement strength. It is especially useful for determining the harmonic content of a signal. Figure 1 shows the waveform of a complex signal in the time domain on the left and frequency domain on the right. The time domain representation only shows that the signal is not a pure sinusoid and provides no further indication why. In the frequency domain, we observe that the waveform comprises of two sine waves with corresponding frequency and amplitude.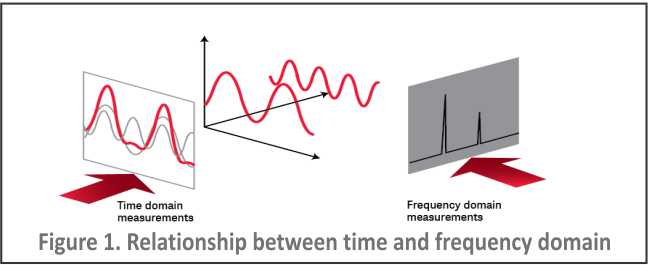
The frequency domain is extremely important for those involved in wireless communications to evaluate devices, systems and signal performance to ensure key feature specifications such as linearity, distortion, noise, and spurious emissions are met.
Spectrum analyzer vs signal analyzer

Marketing Brand Manager,
EMEA & India RF&MW Products,
Keysight Technologies”
The primary use of a spectrum analyzer is to measure and display amplitude versus frequency of known and unknown RF and Microwave signals. With the advent of digital technology and signal processing, modern spectrum analyzers are equipped with more capabilities. By digitizing the signal, phase as well as amplitude is preserved and can be included as part of the information displayed. The term “signal analyzer” is generally used to indicate an instrument that has a spectrum analyzer architecture and an all-digital intermediate frequency (IF) section that processes signals as complex vector quantities, enabling multi-domain operations such as digital modulation analysis and time capture.
A look at uncertainty
When choosing a spectrum analyzer, you need to know if the analyzer covers the amplitude and frequency ranges of the signal to be measured. You also need to know how good the spectrum analyzer is in performing these measurements by looking at its accuracy specifications. Most spectrum analyzers provide both absolute and relative accuracy specifications.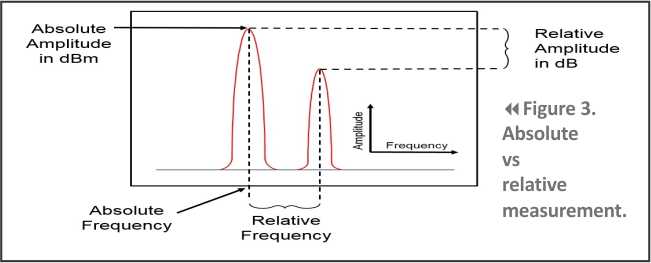
Figure 3 shows the distinction between absolute and relative measurements, where they are respectively made with a single marker and delta markers. For example, measuring the frequency or power level of a carrier (the left peak) is an absolute measurement. Measuring the amplitude of the second harmonic distortion (right peak), relative to the carrier would be a relative measurement.
Amplitude accuracy
All modern spectrum analyzers have a built-in calibration source, which provides a known reference signal of specified amplitude and frequency. Absolute amplitude measurement is in fact a measurement made relative to this reference signal. To translate the absolute calibration to other frequencies and amplitudes, we rely upon the relative accuracy of the analyzer. The range of values in Table 1 represents the amplitude accuracy specifications for a variety of spectrum analyzers.
Many spectrum analyzers use a 50-MHz reference signal. At this frequency, the specified absolute amplitude accuracy is extremely good. For instance, the high performance X-Series signal analyzer gives the best absolute amplitude accuracy of ± 0.24 dB at the reference frequency.
When we make relative measurements on an incoming signal, absolute values do not come into play. For example, we are only interested in how the harmonic differs in amplitude from the fundamental. Worst-case would be when the fundamental occurs at the highest point and the harmonic at the lowest point of the frequency response. If the relative frequency response specification is ± 0.5 dB, the total uncertainty would be twice that value or ± 1.0 dB.
Table 1. Representative values of amplitude uncertainty for common spectrum analyzers.
Frequency accuracy
Absolute frequency uncertainty is often described under the frequency readout accuracy specification and refers to center frequency, start, stop and marker frequencies. Span accuracy comes into play when you make relative measurements.
You can compute frequency accuracy from the sum of sources of errors which can be found in the analyzer’s datasheet. Sources of errors include frequency reference error, span error, and resolution bandwidth (RBW) center-frequency error. Modern analyzers can measure frequencies with an accuracy of < 0.1%, which is ideal for wireless communication applications.
How to improve measurement accuracy?
Before we begin any measurement, we can step through it to see if any controls, like RF attenuator setting, resolution bandwidth or reference level, can be left unchanged. If so, any uncertainties associated with changing these controls drop out. We may also trade off one uncertainty for another, e.g. reference level accuracy against display fidelity, using whichever gives better accuracy. Some tips and best practices for accurate spectra measurements are given below: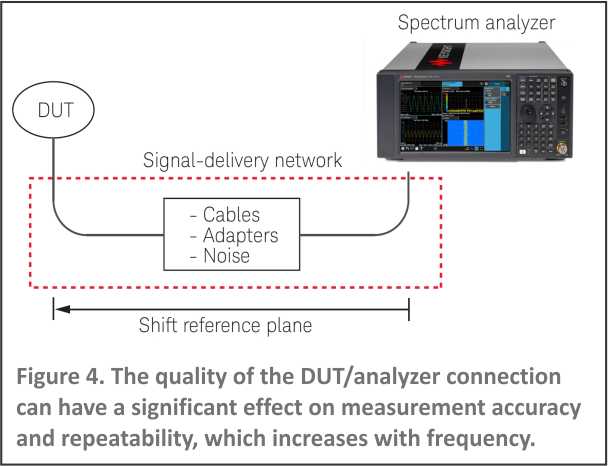
Signal-delivery network
It is always worthwhile to pay careful attention to the elements of the Device Under Test (DUT)/analyzer connection, including the length, type and quality of cables and connectors. The signal-delivery network that connects the DUT to the analyzer, as in Figure 4, may degrade or alter the signal of interest. These unwanted effects can be removed using the analyzer’s built-in amplitude correction function in conjunction with a signal source and a power meter. This process shifts measurement reference plane from the analyzer front panel to the DUT. You can save the correction values for different combinations of cables and adapters.
Connector care
Connector care including proper torque ensure minimum loss, good impedance match and repeatability especially at higher frequencies.
Attenuators for improved match from the mismatch uncertainty equation, improving the match or reflection coefficient of either source or analyzer reduces the mismatch uncertainty. Setting the analyzer’s input attenuator to 0 dB should be avoided if possible as it gives the worst-case mismatch. For best amplitude accuracy, use an input attenuator ≥ 10 dB.
Increase sensitivity for low-level signals
To measure low-level signals, you can improve the analyzer’s sensitivity by minimizing input attenuation, narrowing RBW, and using a preamplifier. These techniques lower displayed average noise level (DANL), separate small signals from noise and enable accurate measurements. Use a preamplifier with low noise and high gain to achieve maximum sensitivity.
Modulated signal
To measure modulated signals, it is important to set the resolution bandwidth wide enough to include the sidebands. Otherwise, the power measured will be inaccurate unless an integrated band power measurement is made. Integrating power from many points measured with a narrow resolution bandwidth is often the most practical technique for wideband digitally modulated signals that are closely spaced.
Frequency accuracy
The indicated frequency of the marker is a function of the frequency calibration on the display, the location of the marker on the display, and the number of display points selected. Narrowing the span and resolution bandwidth minimize these effects and make it easier to place the market at the peak of the response.
Sweep speed
Sweep rates are generally proportional to the square of the resolution bandwidth. A wider setting produces a much faster sweep across a given span compared to a narrower setting.
Calibrator accuracy
Use a more accurate calibrator or one closer to the frequency of interest if available, instead of the built-in calibrator.
Warm-up time
It is helpful to know how the reference in our analyzer behaves under short warm-up conditions, for cases when fast measurement is need. For instance, the Keysight X Series analyzer requires a 5-minute warm up to meet published specifications.
Conclusion
Making a measurement is not enough, you need to make an accurate measurement. No measurement instrument in the world can measure an absolute value, as the measurement will always include an uncertainty. The smaller the uncertainty is, the better the instrument. Acknowledging the existence of an uncertainty and being able to quantify it are an important part of the measurement process. Combine good measurement practices and useful analyzer features to help you mitigate errors and shorten test time.


