For more than a century, electric motor have helped make the world go ‘round. As soon as society first enjoyed the benefits of everything from electric fans to automobiles, people likely asked for these machines to be made quieter. The sound we hear from an electric-powered machine is a multiphysics phenomenon, as a motor’s electromagnetic activity sends vibrations through both the machine and the surrounding air. Using the COMSOL Multiphysics software, we can simulate the acoustical effects generated by a permanent magnet synchronous motor (PMSM) at different speeds of rotation.
Permanent Magnet Synchronous Motors: More Expensive, More Efficient
The permanent magnet synchronous motor is a type of AC-powered motor that offers high power density compared to the more common DC brushless and AC induction motors. For example, a 20 kg (44 lb) PMSM AC motor can deliver more power and torque than a 55 kg (121 lb) AC induction motor, while using less energy.
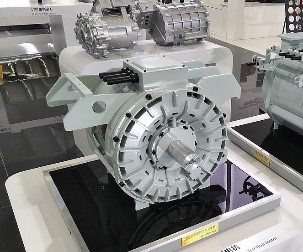
A permanent magnet synchronous motor (PMSM). Image licensed under CC BY-SA 4.0, via Wikimedia Commons.
The primary drawback to a PMSM is the high cost of the rotor’s permanent magnets. Also, AC motors require a more sophisticated power management system than comparable DC motors. However, recent advances in technology have lowered the cost of AC power supply and control, and the benefits of lower energy consumption increasingly outweigh a PMSM’s higher initial cost.
From household appliances like washing machines to HVAC applications such as fans, water pumps, and compressors, PMSM use is expanding. Many electric and hybrid cars, including the Nissan LEAF, Toyota Prius, BMW i3, Chevrolet Bolt, and some Tesla automobiles, are propelled by permanent magnet synchronous electric motor.
The Sounds of Silence: We Notice More Noise in Quieter Surroundings
An electric car is notably quieter than one powered by an internal combustion engine, but that can actually make the management of noise, vibration, and harshness (NVH) even more challenging. A 2015 Hyundai study of electric motor noise in hybrid vehicles explains:
Even though the level of motor noise is relatively low, the powertrain noise without engine firing can be easily perceptible to customers, since masking effect from the internal combustion engine (ICE) is weakened. Indeed, the frequency range of interest may be around 1 kHz which is a sensitive range for human ears.
To mitigate this more apparent noise, engineers can address NVH transmission throughout a car’s structure, but they can also measure and manage motor acoustics at the source.
Modeling the Multiphysics of Electric Motor Noise
When we hear a squeal or a chatter from the shaft or housing of an electric motor, we’re actually responding to the audible effects of electromagnetic activity. A PMSM uses permanent magnets in the rotor and a variable-frequency alternating current traveling through the stator to generate torque. As the rotor turns, the stator uses electric motor currents to generate a magnetic field that follows the speed of rotation of the rotor to generate a consistent torque.
Due to their construction and manufacturing constraints, motors experience electromagnetic forces that are not purely sinusoidal.
The electromagnetic forces contain a main component at the frequency of rotation, but also include variations that are produced at higher frequencies. These variations, called higher-order harmonics, appear at multiples of the first harmonic and can significantly modify the NVH performance of a motor.
Simulation, as demonstrated in the tutorial model featured here, can be used to compute the electromagnetic forces and extract the first and subsequent harmonics. These harmonic forces are used to excite the structure with vibrations that travel through the motor casing and generate pressure waves in the air, which is often responsible for a relevant part of the noise that we hear. As the speed of rotation of the motor is variable, simulation is used to determine the amount of sound generated by each harmonic as the electric motor turns faster.
Visualizing the Acoustic Response to Electromagnetic Forces
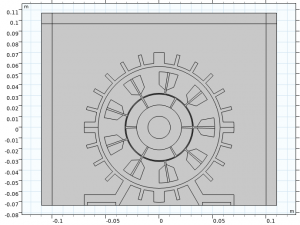
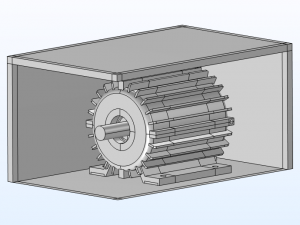
In general, the electromagnetic forces generated during the rotation of a PMSM are really well captured using a 2D model. The vibrations and radiated noise, however, need to be analyzed using the complete 3D geometry. Both the motor section used for the electromagnetics analysis and the 3D geometry with the surrounding acoustic domain are shown below.
2D geometry view (left) and 3D geometry with surrounding acoustic domain (right) of the motor. Some boundaries are hidden for visualization purposes.
Three studies are performed to analyze the PMSM model:
- Transient analysis to determine electromagnetic forces in the time domain for a given speed of rotation.
- Fourier transform to convert the time domain forces into different harmonics in the frequency domain. Frequency-domain analysis allows for an efficient computation of the vibrations and noise in the 3D model.
- Vibroacoustics analysis at each harmonic and at varying speeds of rotations.
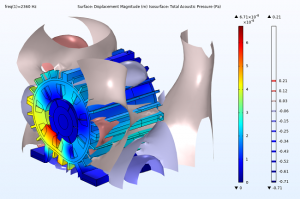
The image below shows the displacement and acoustic pressure generated in the modeled motor by the third harmonic at 2360 Hz.
Displacement (exaggerated) and acoustic pressure generated by the third harmonic at 2360 Hz.
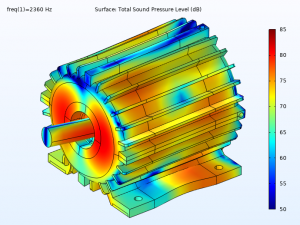
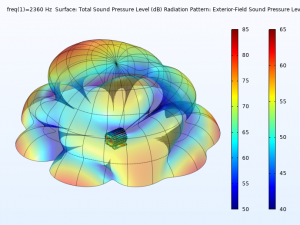
The Exterior Field feature enables you to evaluate the acoustic pressure at any point outside of the computational domain. The image below shows the sound pressure level at the surface of the motor and 0.5 m away from the motor. Note how this radiation pattern has many lobes, which shows that the acoustic response will vary in different hypothetical microphone locations or listening points.
Radiation pattern and sound pressure level at the surface of the motor (left) and 0.5 m away (right).
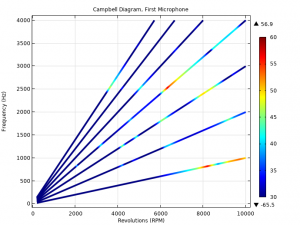
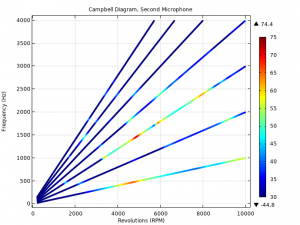
Once the frequency response to each harmonic and speed is known, it can be plotted with a Campbell diagram, sometimes called a waterfall plot.
A Campbell diagram shows the speed of rotation of the motor on the x-axis and the frequency of the noise measured on the y-axis. The color represents the sound pressure level measured at the microphone. As each harmonic is produced at a multiple of the driving PMSM frequency, harmonics are represented as straight lines in the Campbell diagram. The first harmonic lies at the bottom of the diagram and subsequent harmonics are above it.
In the Campbell diagrams below, we can see how the first, third, and fourth harmonics are the main cause of the measured sound pressure level for two microphone positions.
Campbell diagrams at two microphone positions.
Have You Heard?
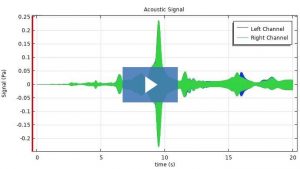
You can actually listen to a simulation of the sounds predicted by this model! As of COMSOL Multiphysics version 5.6, you can export 1D plots to WAV files to listen to your results. Try it out by clicking the audio player below:
By demonstrating the relationship between electromagnetic conditions and their acoustical impact in various locations, a model such as this one can help you pinpoint frequencies where the casing is very efficient at radiating noise, as well as harmonics with a big impact on the total noise profile. These results can help you determine necessary adjustments to rotor slot sizes, shapes, and positions, as well as potential changes to the motor housing and surrounding assemblies.


