With today’s increased incorporation of power electronics and switching devices in power and transportation related applications, measuring the power consumption and performance of the individual components alone is often not sufficient to understand the overall performance and behaviour of a system. Typically engineers involved with these development or service tasks will have to use measuring instruments such as fast sampling data-acquisition recorders that can cope with a wide range of input signals, including measurements of voltage and current coming from power conditioning devices and other signals coming from sensors, controllers, rotary encoders or any possible other input.
In addition, when carrying out service and maintenance tasks on these electro-mechanical systems found in areas such as production facilities, railway systems or smart grids, the task is often to link a certain event or problem to a possible cause. Using a data-acquisition recorder provides the engineer the ability to acquire all signals available from the device under test, and will help in analysing the dynamics in that particular system.
For a full analysis, however, there are key requirements like the calculation of electrical power-related parameters such as active power, power factor, integrated power (consumed energy) and harmonics – which are typically calculated and analysed with software applications as a next step after the measurement is finished. This requires the data acquisition recorder to store the measurement data on a PC or at a remote location, with the engineer continuing the analysis on a PC. Based upon the analysis of the measurement data, a possible next step could be to modify the application and repeat the measurement.
Why real time?
With the increased demand for the efficient use of energy, controlling the power dynamic behaviour of rotary devices, motor drives and other electromechanical processes where the electric power is not stable and depends on the application becomes more important. For example (Fig.1), during the startup of an electric motor, the waveform cycle time and active power will vary for each cycle. In addition, when testing energy behaviour at different load conditions, it is not until after the measurement is finished and calculated in the software that the actual measurement result concerning power behaviour become apparent.
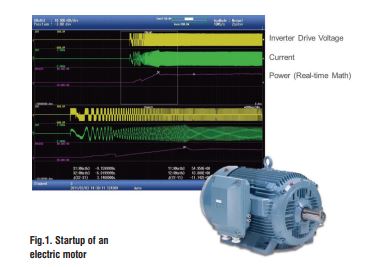
 Potentially significant time savings can be achieved if the calculations of power-related parameters can be carried out by the data-acquisition recorder in order to have measurement results and analysis available with high sample rates when the event happens. For monitoring applications, it becomes important to monitor power calculated values and (in case they exceed a certain threshold level) to capture all signals at high sample rates in order to thoroughly investigate the event.
DSP provides the solution
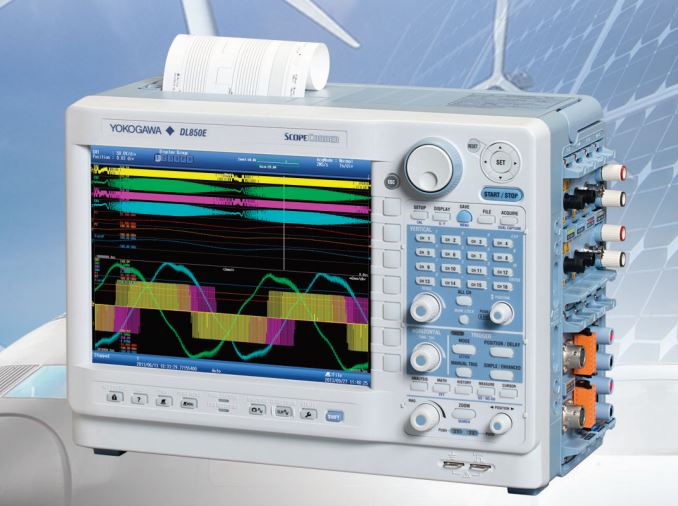
Yokogawa Test & Measurement has developed a solution to satisfy this new measurement requirement. The recently launched DL850E ScopeCorder (Fig.2) (“E” standing for “enhanced”) is a powerful portable data-acquisition recorder that can capture and analyse both transient events and trends over periods of up to 200 days. Using flexible modular inputs, it combines measurements of electrical signals and inputs from physical sensors and CAN / LIN serial buses, and is equipped with a powerful digital signal processor (DSP) which makes the instrument able to calculate and trigger on electrical power-related calculations in real time.
The majority of industrial applications incorporate a variable-speed drive in combination with a 3-phase induction motor. Where an oscilloscope often has a limited channel count and non-isolated input channels, the DL850E can be equipped with 16 or more channels and has a diverse range of input modules, with each channel being individually isolated. The instrument offers direct input of voltages up to 1000 V, with no need for active probing, and samples data at rates up to 100 MS/s with 12- or 16-bit vertical resolution. These features are ideal for capturing variable-speed drive inverter switching signals with high precision. A wide variety of unique acquisition features is included to handle small or large amounts of data. As a result, the DL850E can perform multichannel measurements for longer measurement periods while still being able to precisely capture transient events with the highest detail. Being able to connect the outputs from additional torque sensors, rotary encoders or thermocouples also makes the DL850E ScopeCorder an ideal measuring instrument to enable engineers to improve the design and efficiency of the motor and electric drives as well as reducing size and costs.
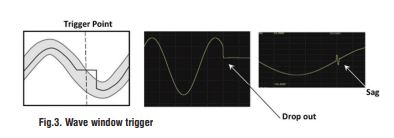
An application example illustrating the true power of the ScopeCorder is the detection of disturbances on AC waveforms found, for instance, during the testing of generators. A specific challenge occurs when the disturbance has a relatively high frequency but a small amplitude: a situation which can be introduced at sudden load changes in turbines. These types of disturbances or glitches cannot be easily detected with the standard level triggers that are typically found in traditional data acquisition recorders: instead, a more dedicated trigger is required because the level trigger would not be able to distinguish between the normal AC waveform and the glitch. A ScopeCorder can use the dedicated wave window trigger: a trigger function for AC power line tests. The ScopeCorder will measure the reference AC waveform and the user can identify a voltage band surrounding the waveform. This way, the instrument will trigger when a sag, impulse or drop out occurs (Fig.3).
But even an advanced trigger like the wave window triggering is sometimes not sufficient to trigger, especially when signals are coming from turbines (where the waveforms might be too distorted and amplitudes of the glitch are small) or when the frequency of the waveform is varying. For these situations, the ScopeCorder can be equipped with a dedicated digital signal processor enabling it to perform mathematical calculations such as arithmetic operators with coefficients, integrals, and differentials as well as higher-order equations on acquired measurement data. The results of these calculations are displayed during waveform capture in real-time. In order to capture the disturbance at the generator, a small amplitude but high-frequency component will have to be detected. This can be easily done by the /G3 real-time math option, which offers to differentiate of the signal.
The differentiation function (Fig.4) plots the rate of change of the signal. In the example shown in Fig.4, we see what occurs when a signal of 50 Hz with a relatively large amplitude has a glitch introduced at 40 kHz with very small amplitude. When differentiating this signal using the dedicated DSP processor, the sudden rate of change increases from 50 Hz to 40 kHz, causing a peak to appear in the real-time channel of the differentiated signal. As this is carried out in real time we can use this channel to set a standard level trigger, and can thus trigger and capture this event and all related signals with it in one synchronised measurement.
 This way we can leave the ScopeCorder continuously monitoring this system for minutes, hours or days, and in case the glitch occurs we are assured that it will be captured and automatically stored by the ScopeCorder. In addition to mathematical operators, steep digital filters can also be selected to isolate or trigger on the amplitude of certain frequency components.
Let us go back to our example of the startup of an electric motor where waveform cycle time and active power vary for each cycle. With the newly introduced /G5 option, the ScopeCorder can trend calculations such as active power, power factor, integrated power and harmonics (Fig.5) using a dedicated DSP that is able to calculate and display up to 126 types of electrical power related parameters in real-time. This can be used to analyse 3-phase inputs and 3-phase outputs of the electric motor drive simultaneously. Using the scaling functions of the input modules, current sensor voltage outputs can be scaled to appear in the display. This enables the user to display raw waveform signals such as voltages and currents along with power calculated parameters and has the capability to trigger on all of them individually.
An application example could be the recording of active power levels during load changes or during the start-up of the motor. With the wealth of trigger possibilities, this offers, the engineer has a powerful tool to identify transients or events quickly and have all data synchronised with, for instance, temperature, vibration and torque in one single measurement overview. Trend waveforms of each order of harmonics, bar-graphs and vector diagram can be displayed. Besides the powerful power calculations, the /G5 option also includes all the functionality of the /G3 option.
The ScopeCorder DL850E allows engineers to measure and analyse a wealth of signals in real time as an aid to speeding up development and fault-finding. In addition to its high-speed multi-channel capabilities plus long memory and isolated input channels, the ability to carry out the real-time measurement and analysis of electrical power opens up a much wider potential range of applications in areas such as power electronics, mechatronics, and transportation.
To learn more, visit http://tmi.yokogawa.com/in/


